The first Global Stocktake (GST), taking place in 2021-2023, must provide clear and actionable information to support Parties to the Paris Agreement in planning and implementing more ambitious actions within this decade. Visualising country progress as performance distributions fulfils the GST’s criteria of evaluating collective progress while communicating that not all countries are the same. In the context of the GST, performance distribution analyses could enable peer pressure among Parties and public scrutiny at the national level, which contribute to the enhancing ambition function of the GST process.
To meet the combined challenges of assessing collective progress and providing actionable information, we propose that the GST use performance distributions, that visualise anonymised information from individual countries.
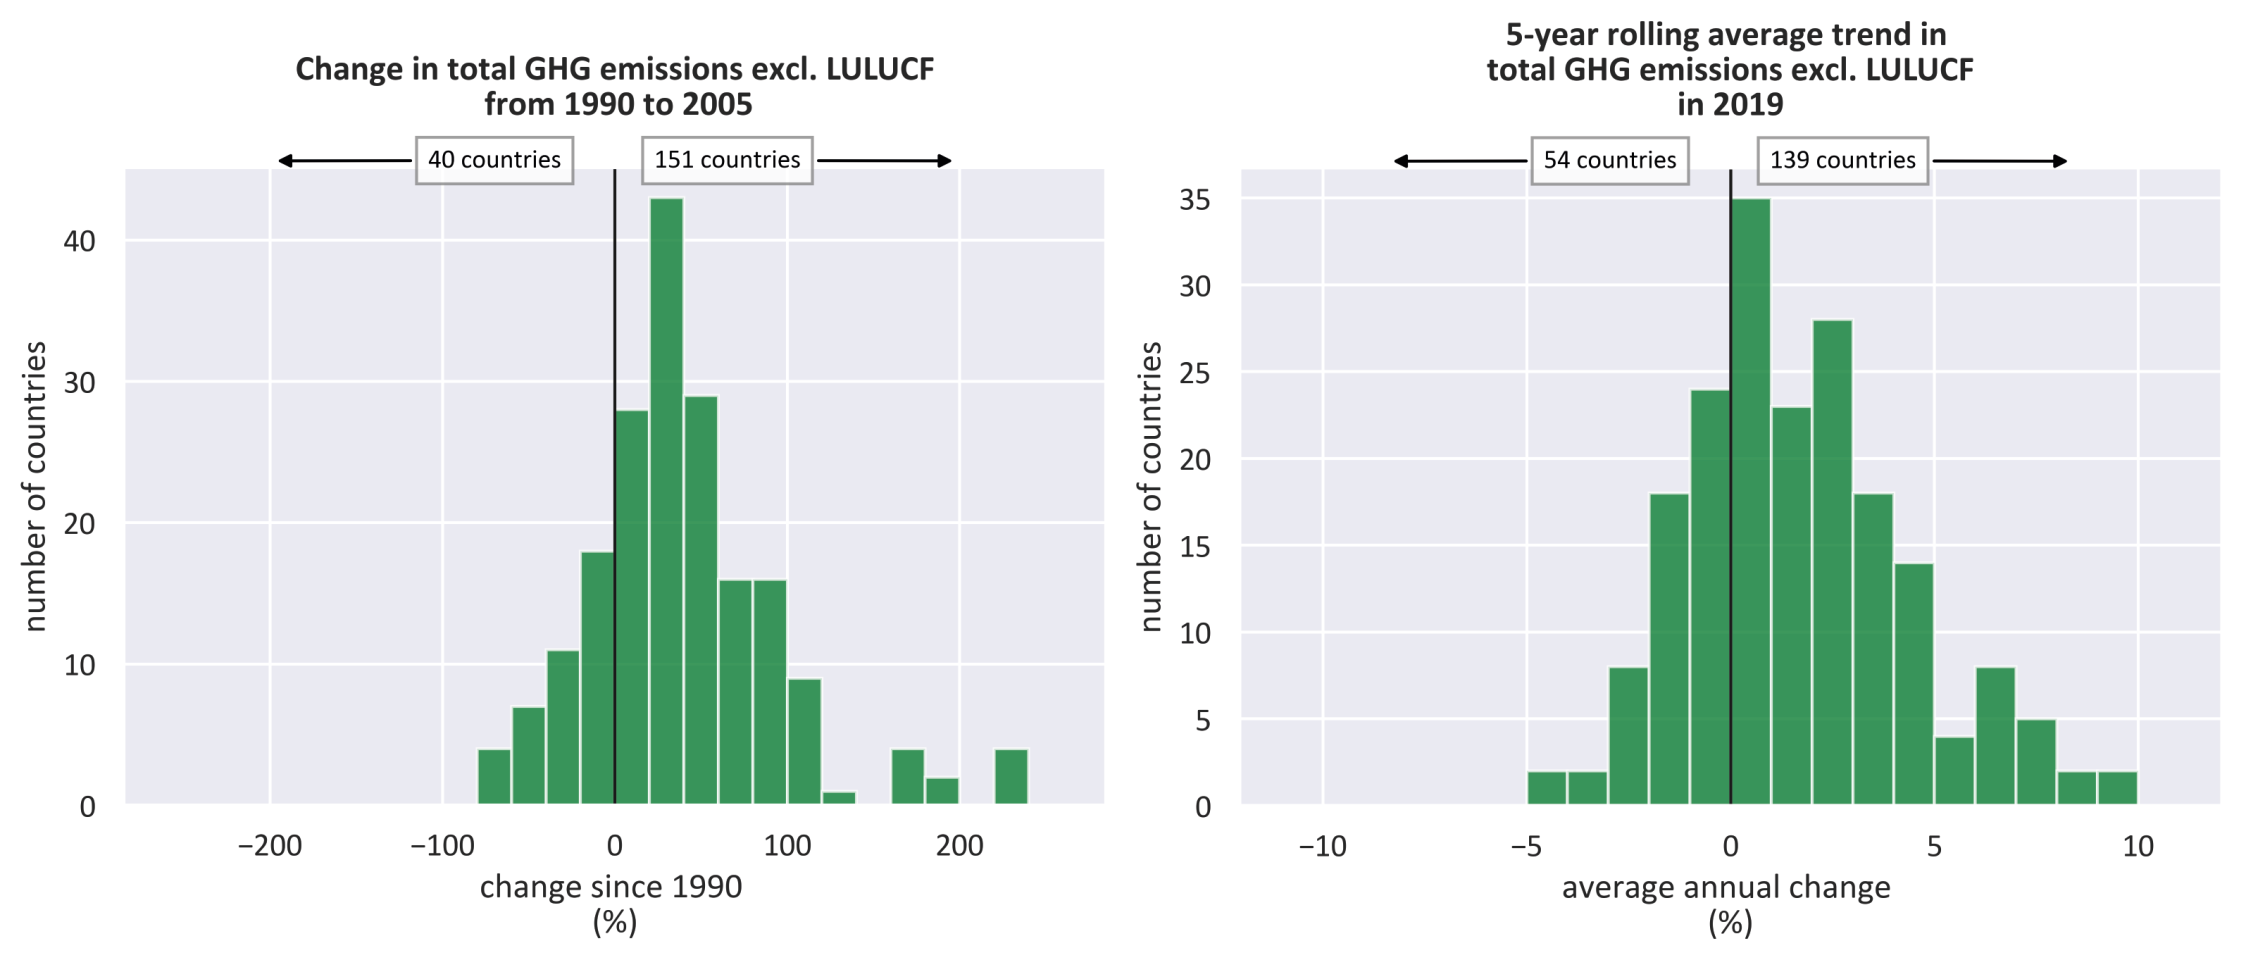
Figure 1: Change in greenhouse gas (GHG) emissions compared to 2005 (left) and average annual change in GHG emissions in the past five years (right). Own figure based on total GHG emissions from the PRIMAP-hist dataset (Gütschow et al., 2016; Gütschow, Günther and Pflüger, 2021).
In assessing current values, or historic changes, the GST takes stock and highlights progress, or lack thereof. Using the example of GHG emissions above, we can observe that current emissions remain above 2005 levels in 139 countries (Figure 1 - left) with emissions in a few having more than doubled since then (change above 100%). In most countries, emissions continue to rise but in 54 countries emissions have declined over the past five years. Frontrunners have a maximum rate of emissions decline of 5% per year, while laggards increase emissions at a rate of almost 10% per year (Figure 1 - right). Over time, a shift in the distribution to the left would show that, collectively, countries have improved their mitigation efforts.
Benefits of visualising information using performance distributions
We argue that performance distributions enable a more effective Global Stocktake because:
- They are aligned with the GST mandate to assess collective progress without singling out individual countries.
- They mainstream outputs of the GST in national-level discussions, as independent actors can locate their countries in the distribution and benchmark their progress against other countries. This facilitates public scrutiny at the national level.
- They assess whether all countries move together or whether a few countries make substantial progress.
This circumnavigates naming-and-shaming while not letting individual countries hide within a global number and provides pride-and-fame illustration of what can be achieved.
The same distributions can be used to assess progress on a broad range of indicators. Assessing progress of sectoral indicators, such as the share of renewable power generation, can be more actionable than emissions data alone. Subject to available data, the figures could be applied beyond the mitigation theme, for instance to visualize progress on international climate finance. Presenting a consistent style of figure should make the information more accessible - once one figure is explained and understood, the principles can be translated to other indicators and figures.