Evaluating climate change mitigation progress under adopted policies
The Paris Agreement does not offer a standard to measure progress but relies on a process of periodic stocktakes to inform ambition-raising cycles.
To contribute to this process, we compare 2021 greenhouse gas emission projections up to 2030 against equivalent projections prepared back in 2015. Both sets of projections were prepared using the same bottom-up modelling approach that accounts for adopted policies at the time.
Although emission projections for the G20 improved since 2015, collectively they still slightly increase until 2030 and remain insufficient to meet the Paris Agreement temperature goals. The G20 must urgently and drastically improve adopted policies and actions to limit the end-of-century warming to 1.5 °C.
Absolute emissions are now 15% lower than projected in 2015
Absolute 2030 emissions from the 2021 projections are expected to be 6.1 GtCO2eq (range: 5.9–6.3 GtCO2eq) or 15% lower than those projected in 2015 (Figure 1).
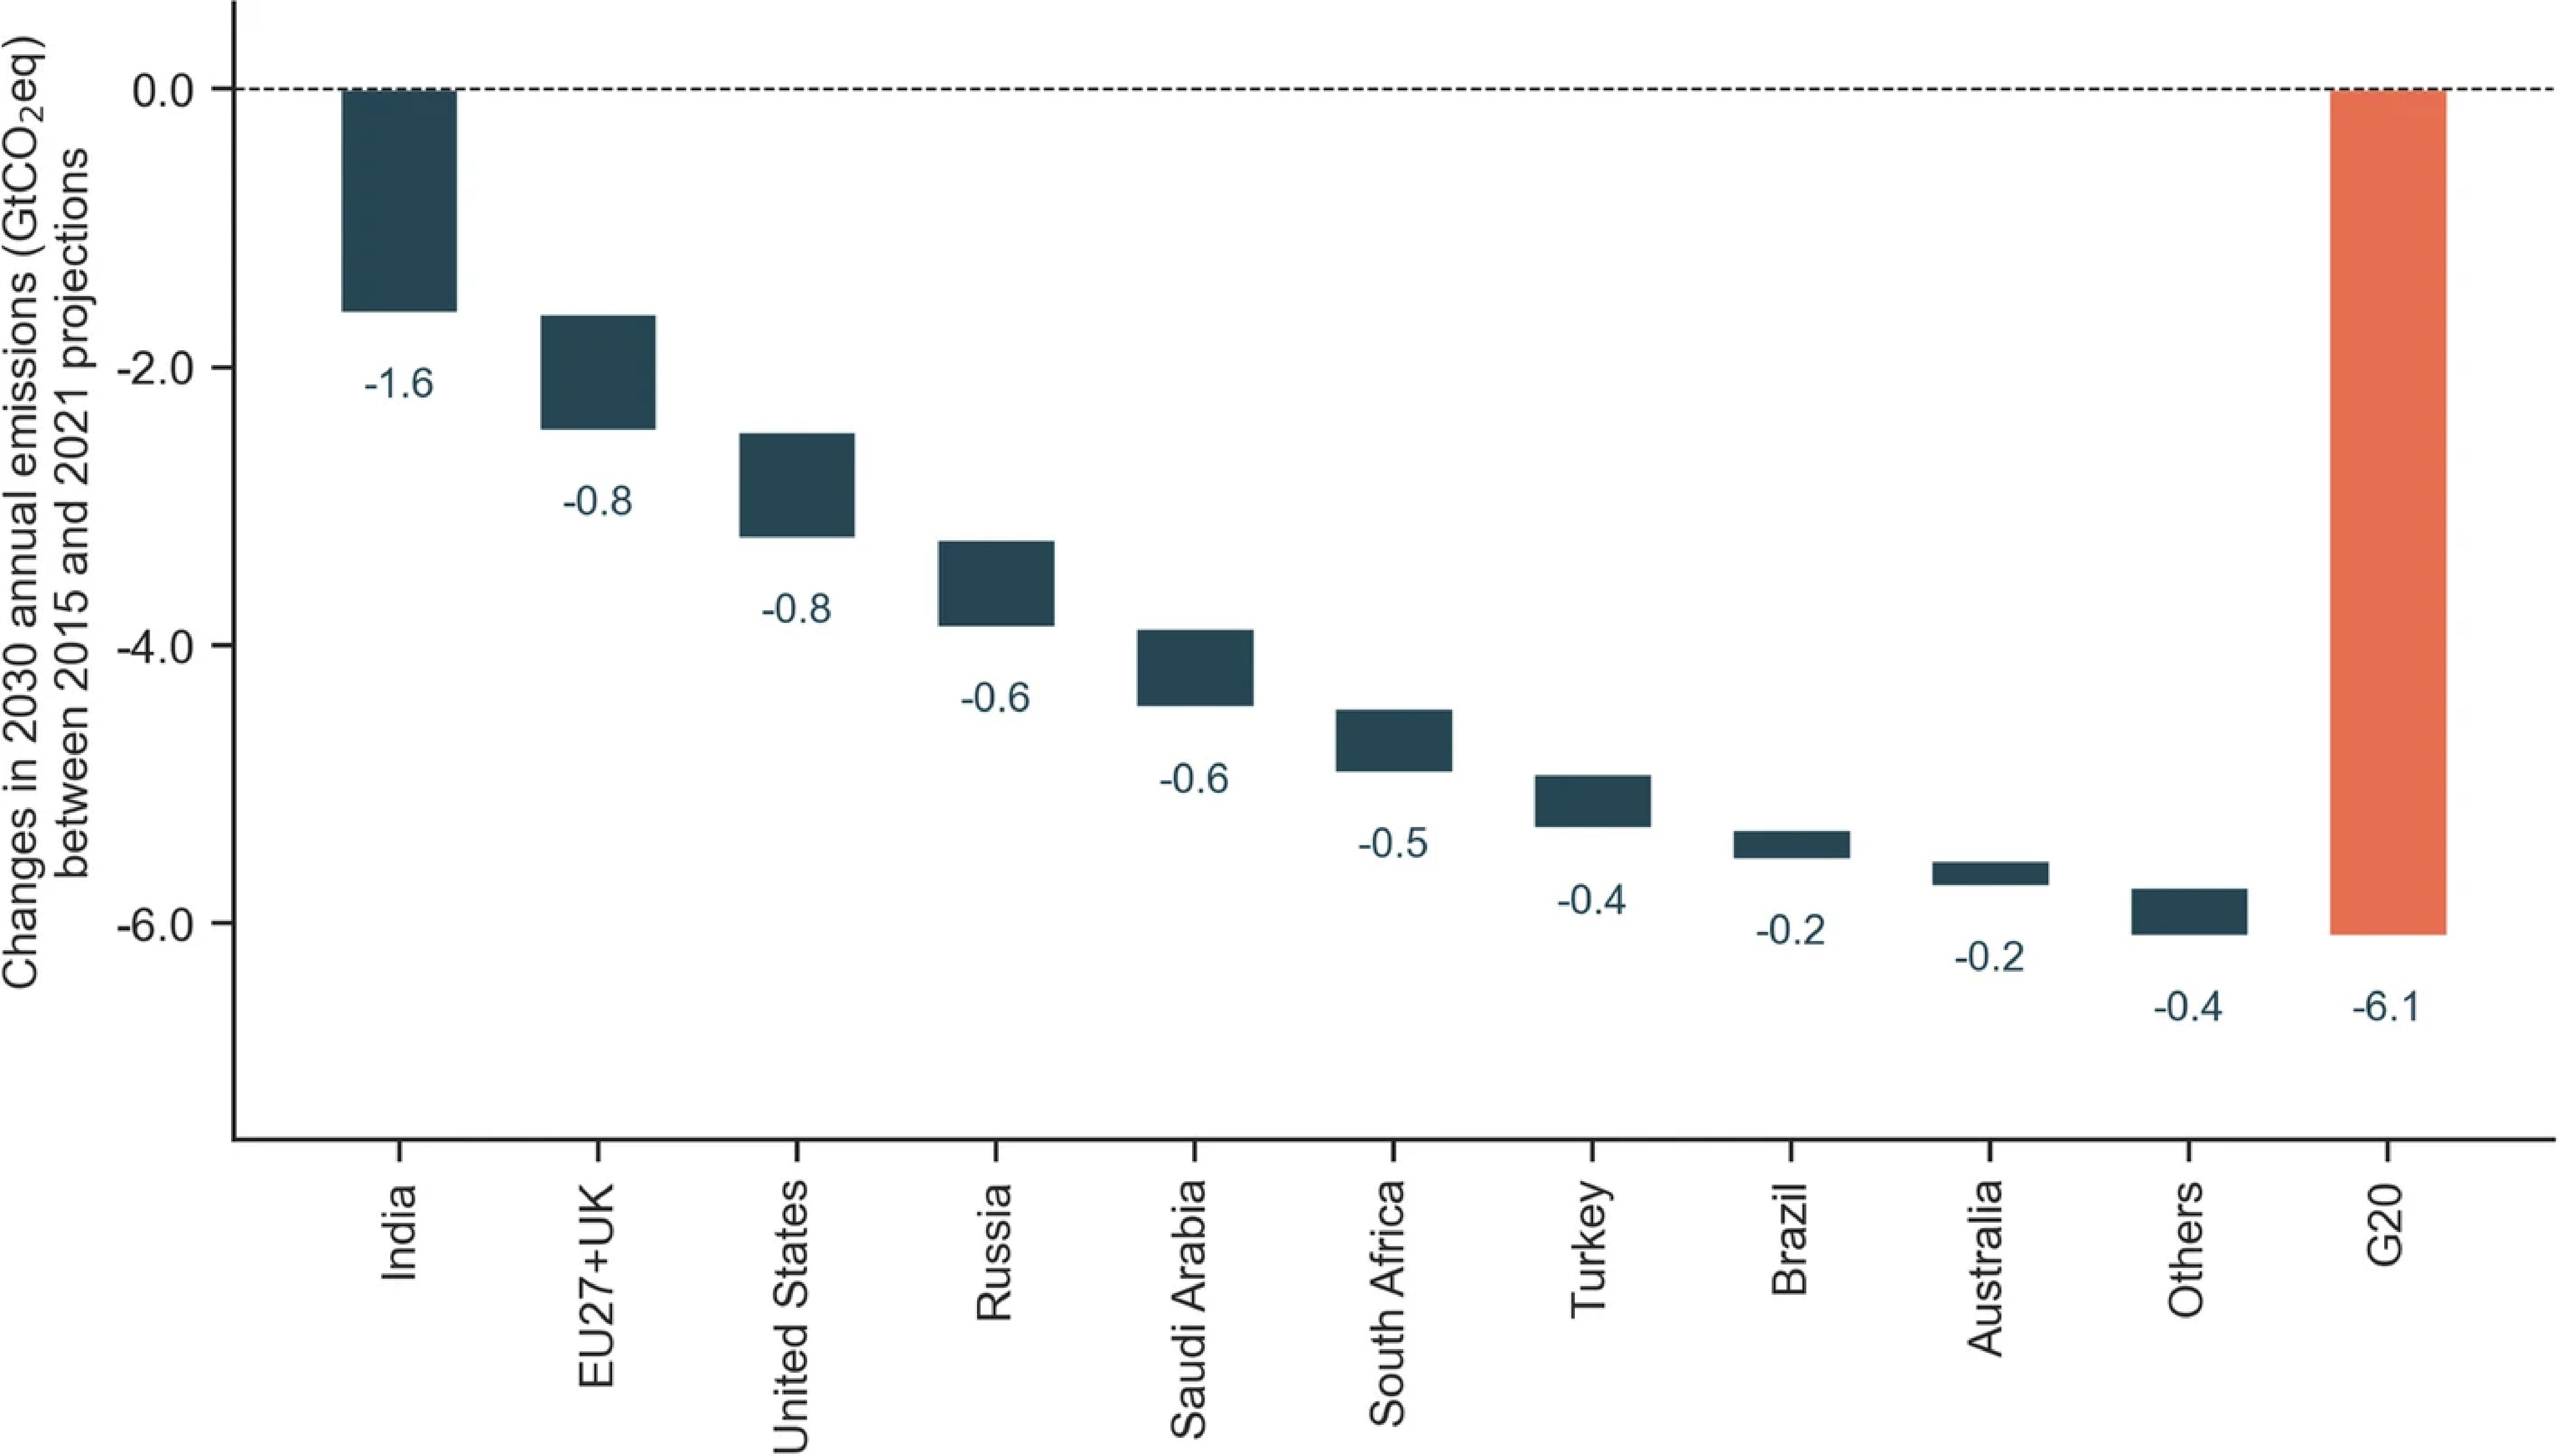
Figure 1: Change in 2030 absolute emission projections. Negative values indicate that projections developed in 2021 are lower than those from 2015. Values based on the middle of the projection range.
Annual emissions grow 1% slower in the coming decade than projected in 2015
The G20 emissions are expected to grow slower between 2021 and 2030 than expected in 2015 (Figure 2). The average annual growth rate is reduced from 1.2 (range: 1.1–1.4%) in 2015 projections to 0.3% (range: 0.0–0.6%) in 2021 projections. Today, more countries are expected to decrease their emissions. We observe negative change rates in the coming decade for Japan, the EU27 + UK, Australia, South Korea, and South Africa.
The slower emissions growth mostly stems from the adoption of new policies and updated expectations on technology uptake and economic growth. However, around one-quarter of these changes are explained by the effects of the COVID-19 pandemic on short-term emissions and economic forecasts.
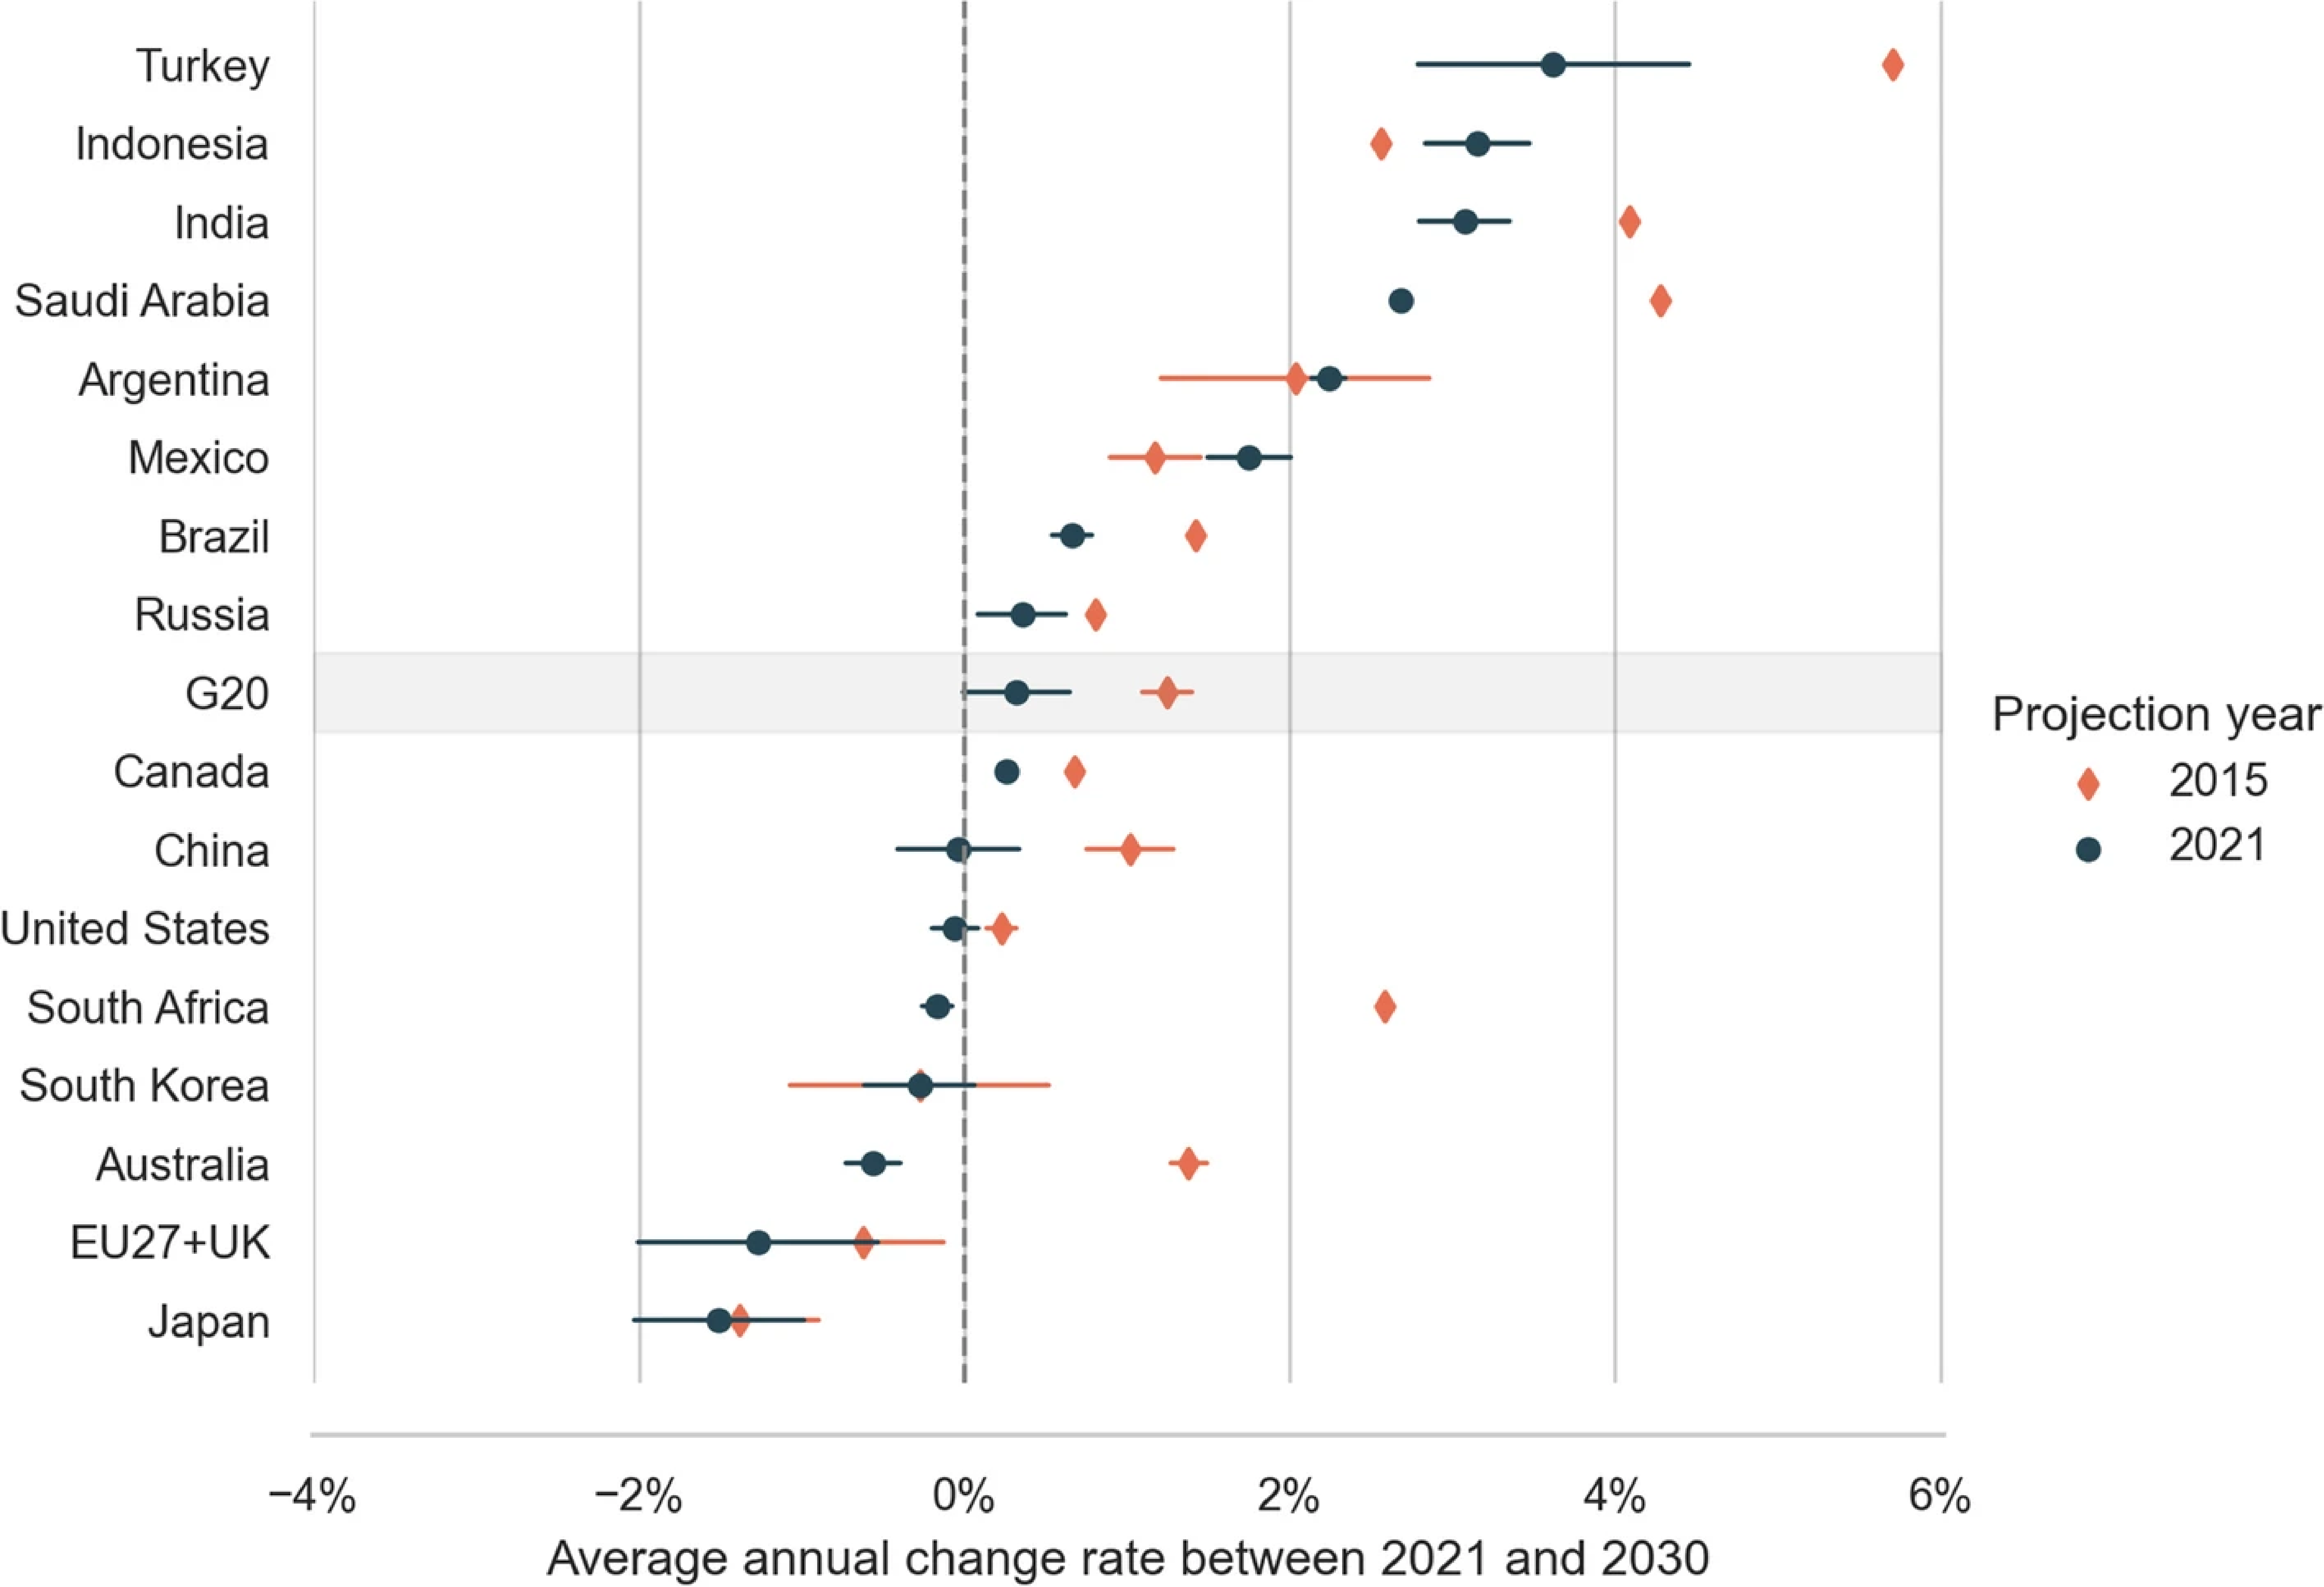
Figure 2: Average yearly change rate in GHG emission projections between 2021 and 2030. Emissions are expected to grow faster in most recent projections for Indonesia, Mexico, and Argentina.
Changes in absolute and per capita emissions projections are possible within a few years
In most countries, emissions per capita trajectories changed comparing 2021 to 2015 projections (Figure 3). However, substantial differences exist across countries.
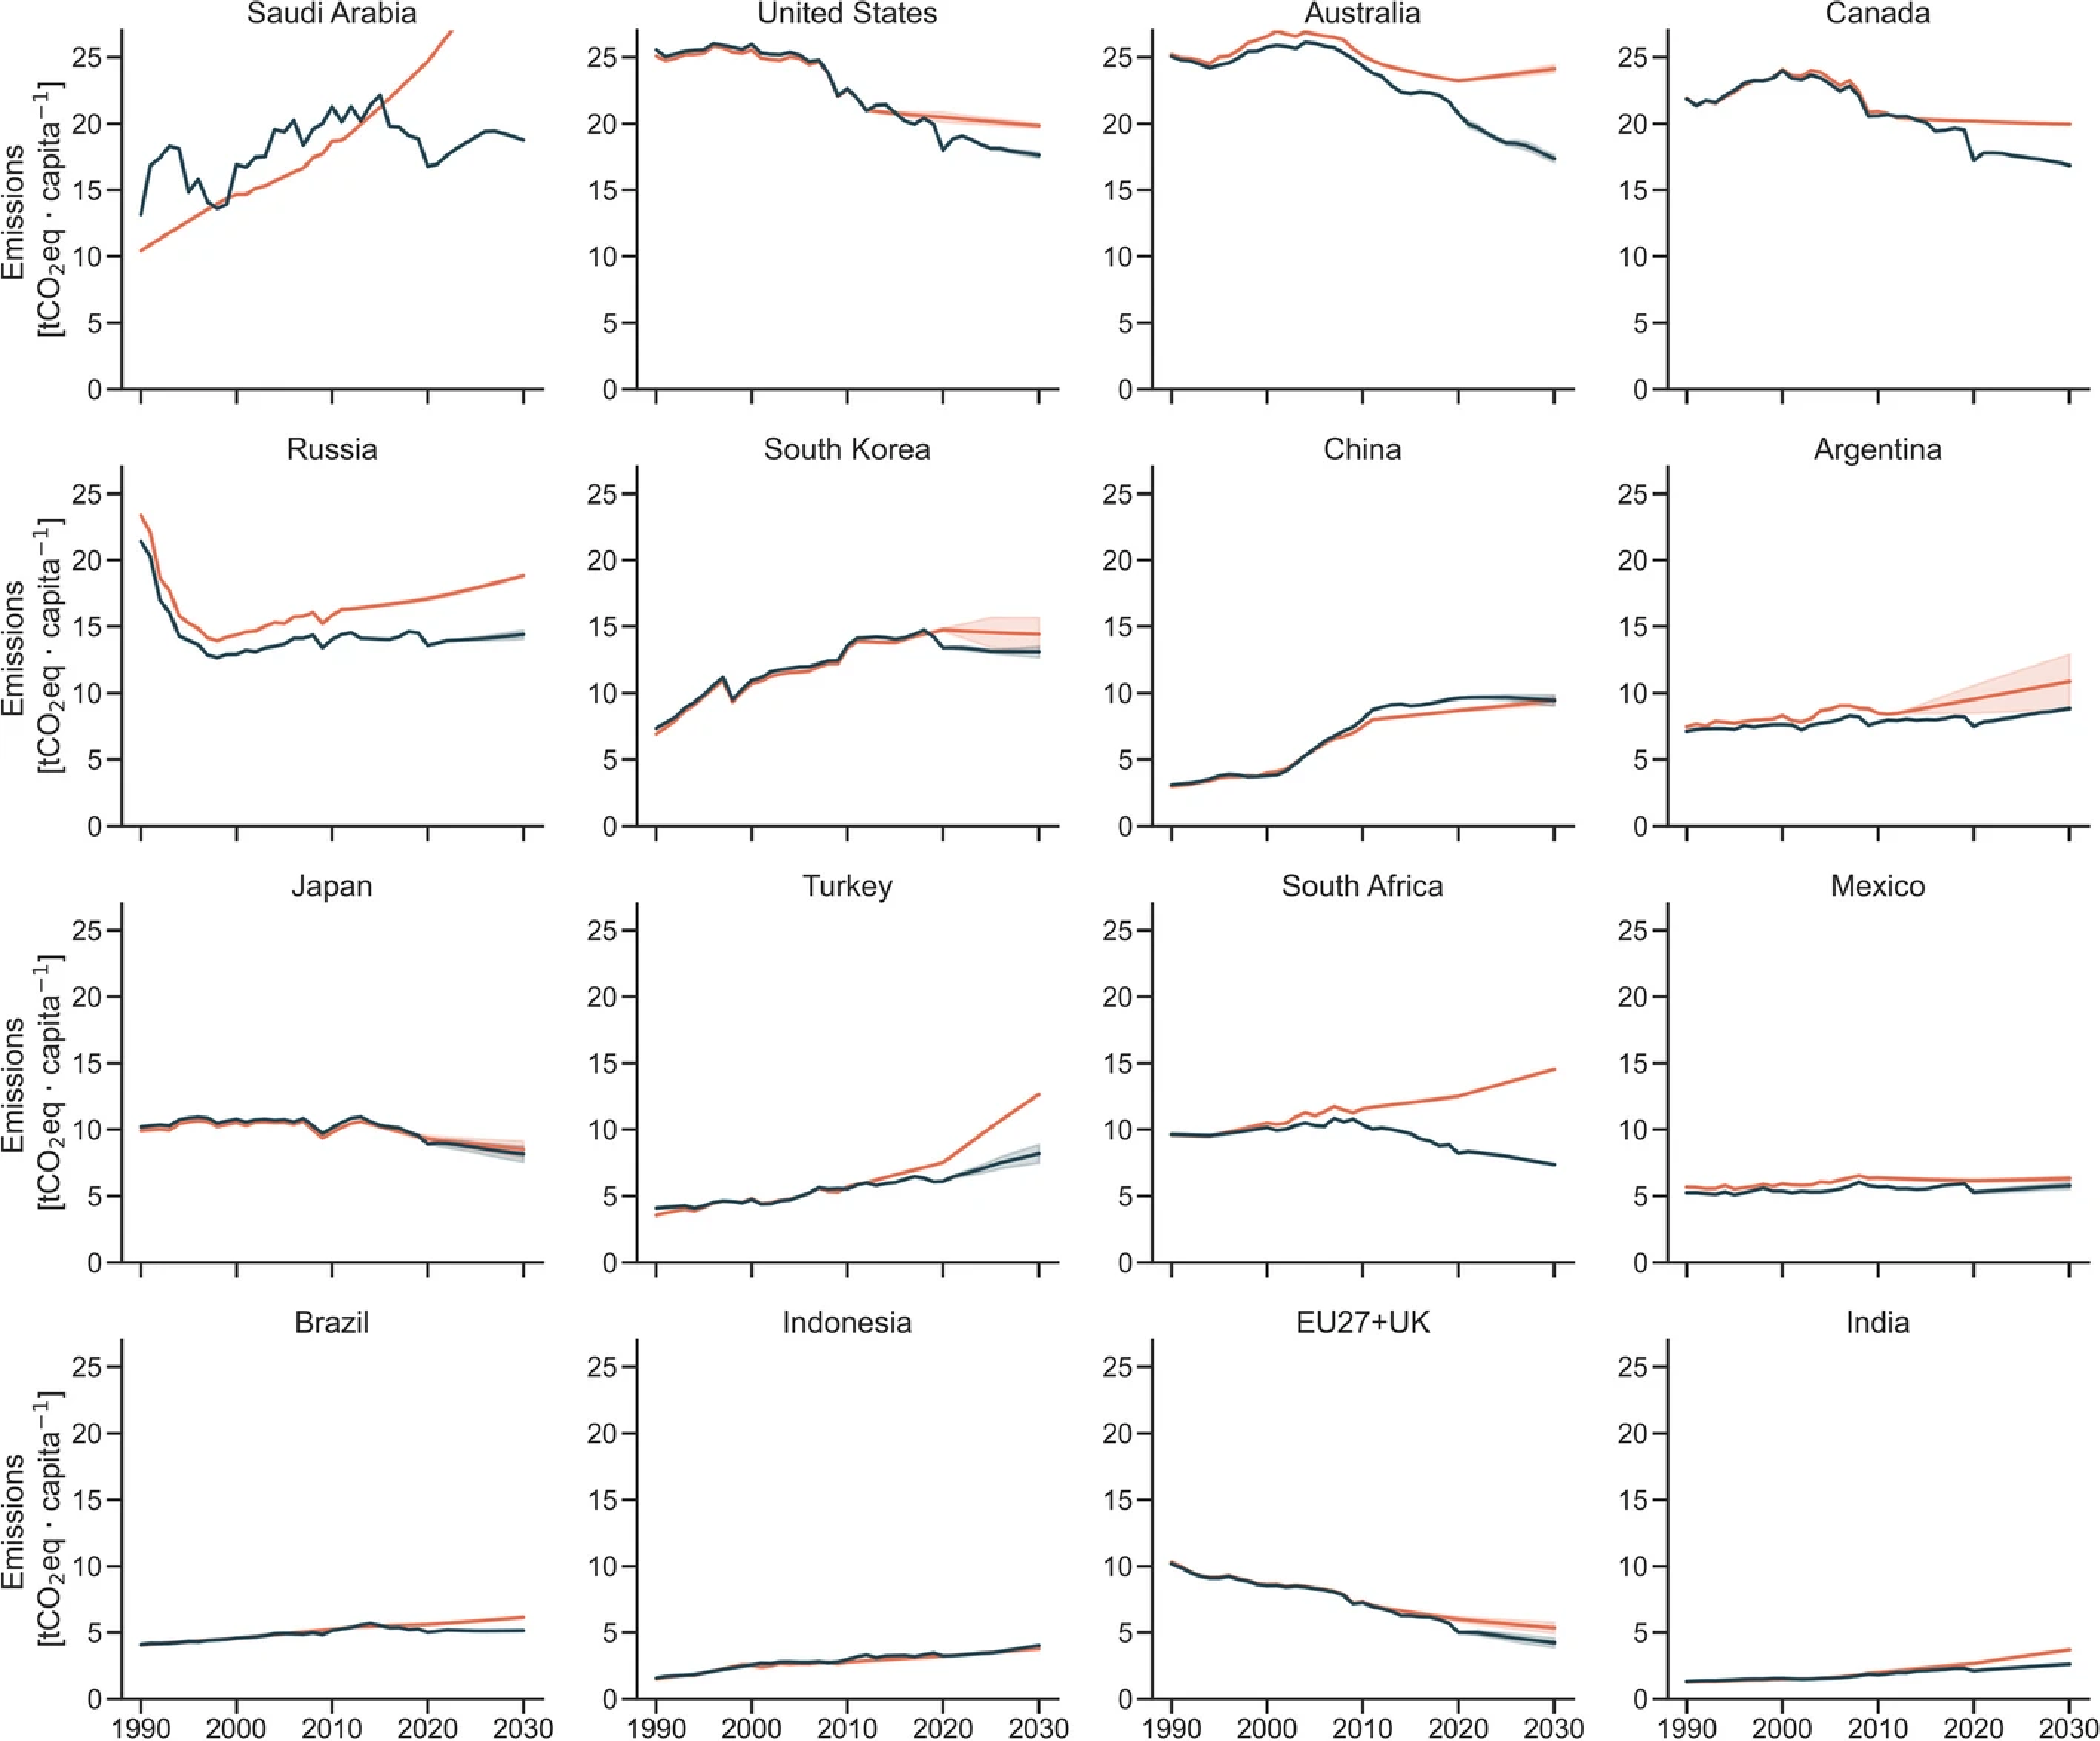
Figure 3: Emissions per capita trajectories developed in 2015 (orange) and 2021 (blue) for the G20 countries. Countries are sorted by emissions per capita levels in 2030. Emissions exclude LULUCF and are reported in AR4 GWP-100.
- South Africa presents the most significant change in emission projections in the coming decade. The country has improved from substantial annual increase on its emissions to an annual decrease between 2021 and 2030.
- The EU27 + UK and Japan were already expected to decrease their emissions in the coming decade but are expected to decrease it faster in 2021 projections. South Korea is likely to slightly decrease its emissions in the coming decade.
- The United States, Canada, and Australia were expected to increase their emissions and now show a slightly declining trend. This is a positive development, but their emissions per capita remain among the highest in the G20.
- China’s 2030 emissions remain at similar levels than projected in 2015. The faster historical emission growth is offset by slower emission growth in the coming decade. Emissions are now expected to peak before 2030.
- Argentina, Brazil, Mexico, Russia, and Saudi Arabia now show lower projected emissions in 2030 than estimated in 2015 but are expected to still increase their emissions. The implementation of Saudi Arabia’s renewable targets could result in plateauing emissions before 2030.
- Turkey slowed their substantial expected emission growth, but emissions increase up to 2030. Emissions in India and Indonesia also increase but remain at low per capita levels (below 5 tCO2eq) in 2030.
The way forward
Emission projections in the G20 shows signs of improvement, but progress remains slow compared to what is needed under the Paris Agreement. Emissions of the G20 as a group are expected to slightly increase in the coming decade. No single G20 country shows rates of emissions decline in line with the necessary global rate to meet the goals of the Paris Agreement. Projected annual growth rates also do not differ statistically when compared to the previous decade. We do not observe the transformative change necessary to reach the global temperature goals. The G20 remain off track to curb their emissions before 2030.
Scenarios presented here estimate the effect of adopted policies and do not constitute a fixed, definite trajectory for the coming decade. Decisions that shape future climate are, and need to be, made today. The G20 group must urgently and drastically improve adopted policies and actions to limit the end-of-century warming to 1.5 °C.